While there’s been a push to make it a legitimate one, Opening Day is something of a national holiday already. If anything, it’s a psychological national holiday, heralding a ceremonial end to winter, hope for the summer, and with it all, warmer weather.
But Mother Nature doesn’t typically follow the Gregorian calendar. The weather on some Opening Days is absolutely stellar. Others are laughable. So, looking back since 2000, who’s typically had the best and worst weather to deal with on Opening Day?
The procedure for this was relatively simple. First of all, we’ll define the Opening Day game as the first game of the regular season played by an MLB team in the US or Canada (not their HOME opener…just their first game). Games in Latin America or overseas that count in the regular season but occur before US Opening Day were not counted. An average Major League Baseball game takes just under three hours to complete (don’t tell that to Yankees and Red Sox fans). For simplicity, I looked at the start time of every Opening Day (or first regular season game) for every team back to 2000. Using Weather Underground’s hourly observations (similar to this one for Philly in 2007), I looked at the three hour window (four top of the hour data observations) starting just prior to the start of the game. So if the game began at 1:05 PM local time, I looked at the 1PM, 2PM, 3PM, and 4PM observations. I averaged the temperature over those hours, noted whether it rained or snowed in that window (rain prior to games doesn’t count), noted if there were any delays during the game because of it, and took the maximum wind gust recorded from those sites in the three hour window.
I will eventually combine all the variables into one “game score,” which could then be applied through the season to see who typically is handicapped by weather the most.
A couple notes:
- If the game occurred in a dome or had a note in the box score that it was indoors, the average game temperature was set to 72° and max wind to zero. This can fluctuate from dome to dome of course, but we’ll assume 72° to be an “ideal” indoor temperature. Most box scores from Baseball Reference back through about 2002 noted if the game was played indoors or not.
- If the first game was postponed due to weather, a note was made, but for the stats, the first actual game played was used.
- Cincinnati traditionally opens the season at home every year, so there is no geographic variability for them, which may put them at a slight disadvantage.
- For Chicago, games opened at home by the White Sox used Midway Airport for data, while games opened by the Cubs used O’Hare Airport.
- In New York, Mets games used LaGuardia data, while Yankees games used Central Park data.
- In SoCal, Dodgers games used Downtown Los Angeles data (CQT), while Angels games used John Wayne Airport (Santa Ana) data.
Temperature
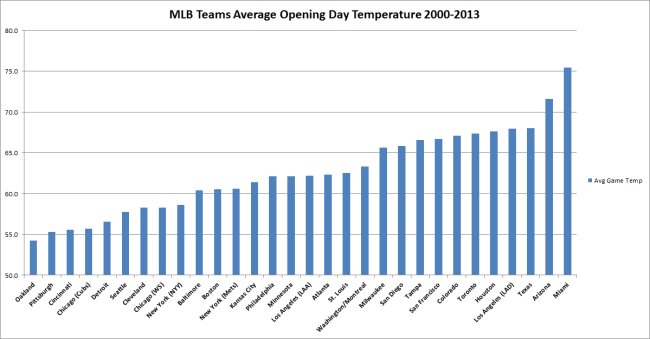
You may be surprised to learn that the team that has averaged the coldest temperatures on Opening Day isn’t a northern climate team at all. It’s actually the Oakland A’s, with an average game temperature of 54.2°F. Next would be a bunch of Midwest teams, as you would probably expect: Pittsburgh, Cincinnati, the Cubs, and Detroit, all averaging between 55° and 57°.
The other end of the spectrum may not surprise you much at all. Miami leads the way with the warmest average Opening Day since 2000, checking in at a cozy 75.5°F. Arizona follows at 71.6°F, then comes Texas and Chavez Ravine for the Dodgers at 68.0°F each.
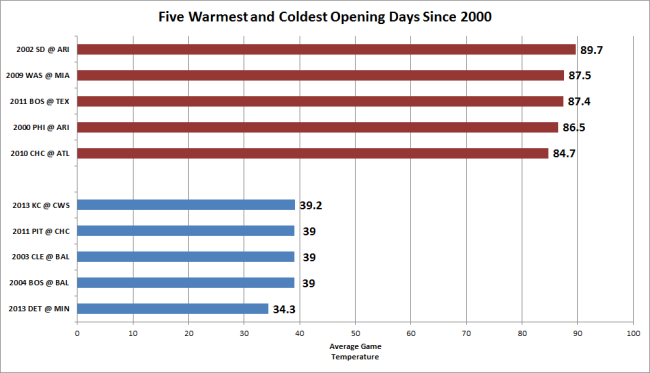
The coldest Opening Day since 2000 was last year in Minneapolis for the Tigers/Twins. The average temperature for that game was 34.3°F. Unofficially, the warmest Opening Day since 2000 was 4/1/02 in Arizona for the Padres/Diamondbacks. I say “unofficially,” as all evidence I found, including the box score, suggested that this game was played with the roof open. However, with a gametime average temperature of 89.7°F, it was quite warm. And the only visual evidence I found was this picture of the 2002 ring ceremony, which I believe occurred on that day, with lighting that appears to be of the indoor variety, so I openly wonder.
Anyway, here are the five warmest and coldest Opening Day games since 2000:
Snow/Rain
Since 2000, 15 Opening Day games have been impacted by rain at some point and two by snow. The two snow games were Cleveland at Baltimore in 2003 and the Mets at the Reds in 2009. Four games were postponed and later made up.
“Dome” Openers
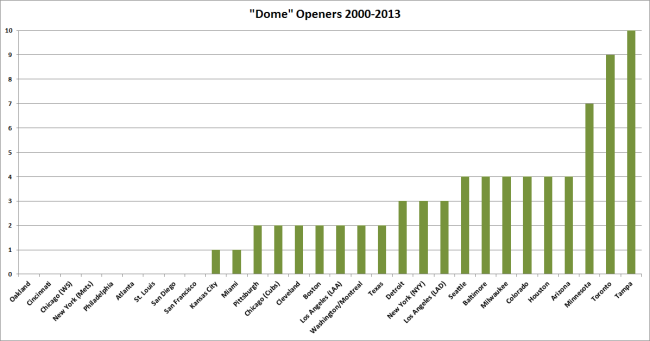
Who has had the most Opening Day games in neutral weather? Congrats are in order for the Tampa Bay Rays. Since 2000, they have opened in a dome setting (either in Minneapolis or St. Petersburg) a total of 10 times, or 71.4% of their Opening Day games. Toronto follows suit with 9 “dome” openers, all but one at the Skydome/Rogers Centre. Of note, of the nine teams that have never opened the season in a dome, seven are from the NL. Hearty souls.
Wind
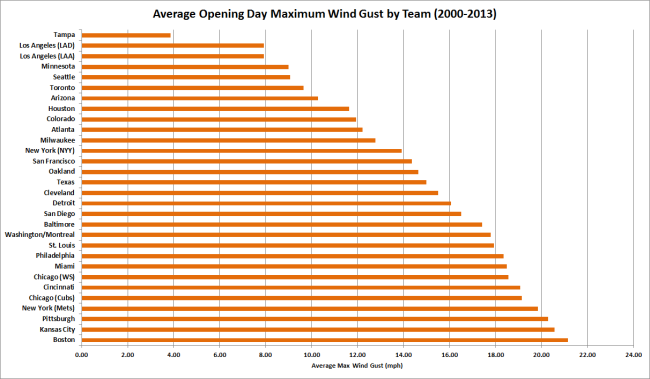
The strongest wind gust occurring during a game was the 2006 Reds home opener vs. the Cubs, in which gusts topped out at 40 mph. Temperatures in the 40s didn’t help matters much. Below is a chart of the average maximum wind gust endured by each team in Opening Day games since 2000. The Red Sox have contended with the strongest wind gusts on average, while Tampa and its 10 “dome” openers has typically dealt with the least.
Next up, I’ll be scoring each game based on temperature, wind, and precipitation to try and determine who has had the absolute worst or absolute best Opening Days. This could also be utilized throughout the rest of the season to make various assumptions about weather. Almost like a game score for weather, which could then be applied to other statistics if need be. Likely something beyond my capacity to implement, but if interested, shoot me a message on Twitter. @mattlanza


