While it is still fresh, some thoughts on this storm.
1.) Give New Jersey the record it deserves. Being a native of New Jersey, I sincerely hope NWS investigates the 33″ Morris Plains and 35″ CoCoRaHS ob from Mine Hill. The 24 hour record for snow in Jersey was 32″ in 1915 in Rutherford. Based on the timing of snow obs at Morristown (MMU) and Somerville (SMQ), I suspect almost all this snow fell within a 24 hour period, and if the totals can be vetted and verified, a new state record should be established.
2.) Kudos to forecasters and communicators. While this was a challenging storm to pin down, I thought almost *all* forecasts for this event were incredibly well done. Everyone deserves credit. Unless you bought the NAM literally and took 1-2′ of snow to I-90 in Massachusetts, or unless you completely ruled out any chance of New York City seeing major snows, you did well in this event.
Between the uncertainty of the northern fringe gradient, the potential for epic snows around DC, the coastal flooding potential, there was a lot to communicate in this event. In my opinion, it was all done very effectively by so many within the weather community, from the NWS, TV, private sector, and social media types.
3.) It’s not the model, it’s how you use it. The amount of “modelology” surrounding this event was…annoying to say the least. So many people declaring the NAM victorious. At one point or another, most major global models indicated enough variability and risk on the northern fringe of the snow to include most of New Jersey and New York City within the “margin of error” so to speak. The NAM did not “win.” Again, judging by the map above, if you lived in Hartford or Springfield, MA or Boston and used the NAM, you had a lot of egg on your face. That’s not an inconsequential populous. Yes, the NAM was the more aggressive model in New York City and on that metric alone, it did well. But it didn’t win. No model “wins.” As a forecaster, it’s your job to objectively analyze the models…all of them…use every tool in your toolbox and make a call. If you blended the NAM with the RGEM and the Euro/GFS, well then you did *damn* good in this event with your snow forecast most likely. Likewise, if you outright dismissed the NAM because of last winter’s NYC debacle, you probably failed too. Recency bias will kill you. Many of us joked about the NAM being the NAM…and that is certainly exaggerated by some of us (including me…I do use the NAM daily when forecasting for Texas and Louisiana, and I have used it aggressively at times). It has a reputation for being sketchy, but I know most rational forecasters do use it and consider it.
We just can’t turn this into some training camp competition. If you use the NAM alone for the next event, I guarantee you your forecast will have serious shortcomings. Use all the tools; know their strengths and weaknesses in the areas you care about and leverage them to your advantage as a forecaster. And don’t fall prey to recency bias.
Fully understanding weather and changes in climate in places is heavily dependent on having a long set of reliable actual measured data at those places. When we can’t depend on data being reliable, what use do we have for it? Why do we have a top 10 list of snowstorms? Why even bother? It’s time for someone to step in, standardize, and properly coordinate snow measurements at places. Cost isn’t an issue. The way I’d approach it: You know how many people would volunteer to do it correctly and love every second of it? Find a spot representative of a city (not an airport across from it and adjacent to a river), probably on state or federal property, and have a team of volunteers at the ready, able to coordinate, trained properly by NWS, and eager to jump in when snow is predicted. Adjust the site as needed for changes in population distribution, new construction, etc. We’re making this a lot more difficult than it needs to be.
5.) Storm names are fine, but we don’t need 30 of them. When they started, I was skeptical of The Weather Channel naming storms, though I believed from the beginning that it would be a successful venture. I think to this point, the storm name concept has worked. I get the frustration, but that ship has sailed and it’s not coming back. So we either do it right or we continue doing it this way, where there were at least 6-7 different storm name hashtags for the same storm. It’s a patchwork free-for-all, and it would be nice if we could streamline it. It would be better for everyone. The research argument is simple: How on earth can we find pictures and tweets from this event without searching through eleventy different hashtags? Instead of still griping about the fact that it’s done, come up with a way to do it better and get everyone to agree. It will be less difficult than anyone thinks, but to make it universal, it can only come from the NWS. It’s time.
If you haven’t thought of the Weezer song with regard to this storm, you’ve failed me. It deserves some parody. I tried. Oh well. Onward…
What’s changed since yesterday, Matt?
Not much. Other than bread and milk supplies in the grocery store being dwindled.
The storm is still coming.
It still appears the metro Washington, DC area is the bullseye for snow.
Coastal flooding is still a serious concern.
Blizzard Watches have been expanded to include much of Jersey, Philly, and the New York City area and Blizzard Warnings are posted for DC and Baltimore.
The northern edge of the storm is still going to drive most meteorologists to their local bar.
So how much snow for me?
Here’s my updated map:
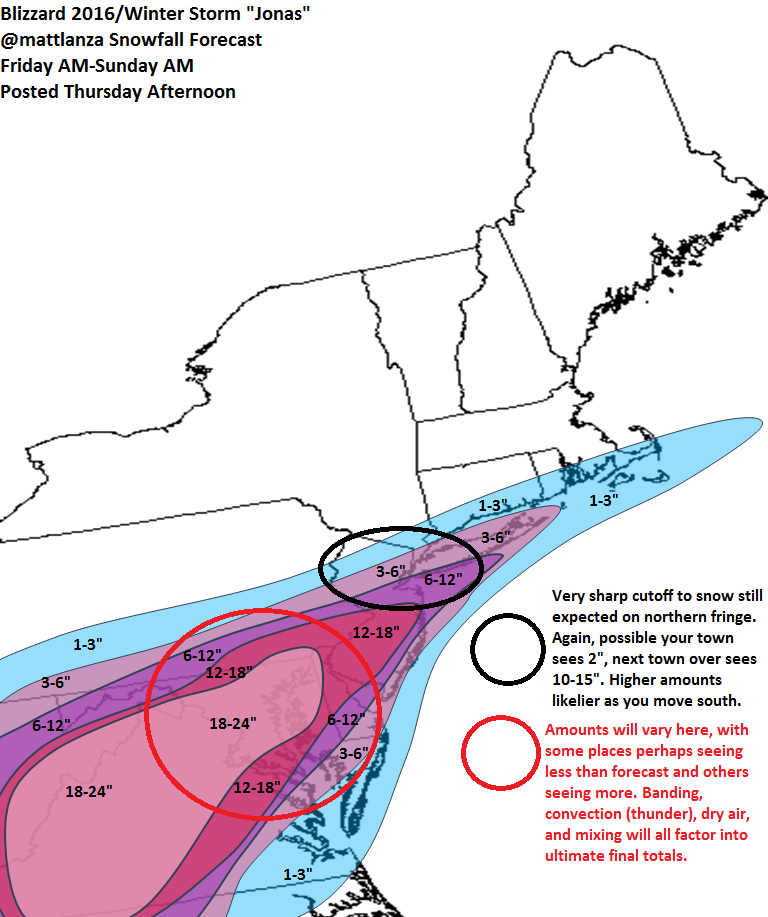
My own personal snow forecast as of 5:30 PM ET Thursday. Again, not official, but my way of expressing it.
Again, I’ve highlighted the two key areas of uncertainty. The northern fringe is going to be a royal pain. There are some models that still bring good snow 8-12″ to NYC, but I don’t personally buy that scenario right now. Based on my experience, these sorts of storms have disappointed on the northern fringe, so I’d rather take a conservative stance there.
From Philly into Baltimore and DC, it gets complicated too. You’ll have a number of factors driving snow totals. I expect there to be issues with mixing in spots. Convection (thunderstorms…yes, thundersnow) will also be likely with this storm. In those cases, sometimes strong bands of snow setup over one place and effectively “rob” another of snowfall. So it’s possible that the final snow totals will not look this uniform. You could easily go from 18″ one place, to 10-12″ a couple towns over, back to 18″ a couple towns over from that. It’s chaotic. Snow forecasts aren’t meant to be simple.
What about the blizzard part?
Yes, Blizzard Watches and Warnings are posted all over. Fun fact: The amount of snow you see has 0 factor in whether or not a storm is defined as a blizzard. Why is that? My honest answer is because we like to make things difficult on ourselves as forecasters and communicators. That aside, it has to do with impacts mostly. A blizzard is supposed to mean wind, which limits how many storms meet the criteria of one…thus making it special and making it stand out.
For a storm to be a blizzard, it has to have 3 hours of winds sustained at or frequently gusting to 35 mph and visibility below 1/4 mile. That’s all. So we’ll see if that gets achieved, but based on model data, yes, it looks like blizzard criteria will be met at many places. For the sake of yourself, stay home Saturday.
How about the coastal flooding?
Here are the very latest tidal forecasts for Cape May, Atlantic City, and Sandy Hook. You can select others from those sites.
I heard this was going to be like Sandy?
Here’s something that agitated me today. I heard from several people somewhat panicked, thinking this was going to be Sandy II. Sandy was a 940 mb monster storm to the south of NJ, that was dragging days of water across the Atlantic Ocean directly into Jersey and New York. This storm will be strong, but it will be moving away from the coast. It won’t have nearly the same characteristics as Sandy did. Meteorologically, it’s like comparing apples to oranges.
But in terms of actual impact what does it mean? It means something worse than what you saw back in October with Joaquin, but short of what you saw in Sandy. It means a lot of water, yes, and major coastal flooding and a top 10 event perhaps. It means problems. The coast is more vulnerable now than it was 5 years ago.
That said, it does notmean mass devastation like was seen in Sandy. So you are right to be preparing and be concerned. But should you panic? No. Make your preparations as you would for any major coastal storm. Remain calm and heed the forecasts of the National Weather Service.
This will likely be my final forecast post on this storm. Thanks for reading and hope you have some time to enjoy the power of nature without being impacted too hard.
I don’t have any mom texts to run with today, but I do have a map. We’ll get to that shortly. Let’s break things down.
So what’s changed since yesterday, Matt?
Honestly? Not much really. We still have a storm. It’s still early in the game for snow forecast maps, but we can at least make some assumptions. We still have a major coastal flooding issue to deal with. We do have blizzard watches posted, among other NWS watches and warnings. All this means is “prepare for a snowstorm.”
Where are the watches and warnings?
Glad you asked. Here:
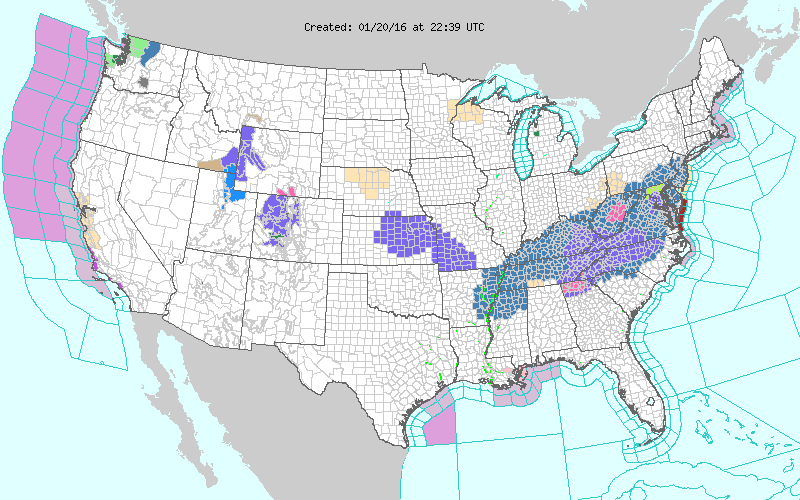
National Weather Service Watch/Warning Map as of 5:45 ET Wednesday
In the East, the purple are winter weather advisories, the blue winter storm watches, the pink winter storm warnings, and the green near DC is a Blizzard Watch. Consult your local NWS office website for what it all means exactly, but the bottom line is a major winter storm is going impact places from Central Arkansas to New York City.
Has the coastal flooding idea changed?
Not really. There have been some forecast tweaks, but overall you’re still looking at a top 5-10 coastal flooding event along the Jersey and Delaware Shore, and possibly for places south and north of there also. Basically, this should be the worst you’ve seen since Sandy. It should *not* match Sandy in most places (though in Cape May and Delaware it’s going to come close), but I don’t want that to diminish the significance. The coast is far more vulnerable in spots now than it was then, so just because it’s not Sandy II, does not mean it’s going to bust. This is a big deal. Here are the very latest tidal forecasts for Cape May, Atlantic City, and Sandy Hook.
This flooding event will rival some of the great nor’easters in memory. Think Ash Wednesday 1962, Halloween 1991, December 1992. This storm will have elements of those storms and it should be treated seriously if you live on the coast or back bays.
Alright, so talk to me about snow.
Here is *my* snow forecast thinking. This is not an official forecast. It’s subject to change, and you should always consult the official NWS forecast or local TV for the most up to date info. Yes, I’m a native of Jersey and spent 5 winters drawing snow maps in Upstate New York when I worked in Syracuse and Utica, but I live in Texas now. I can only do so much.
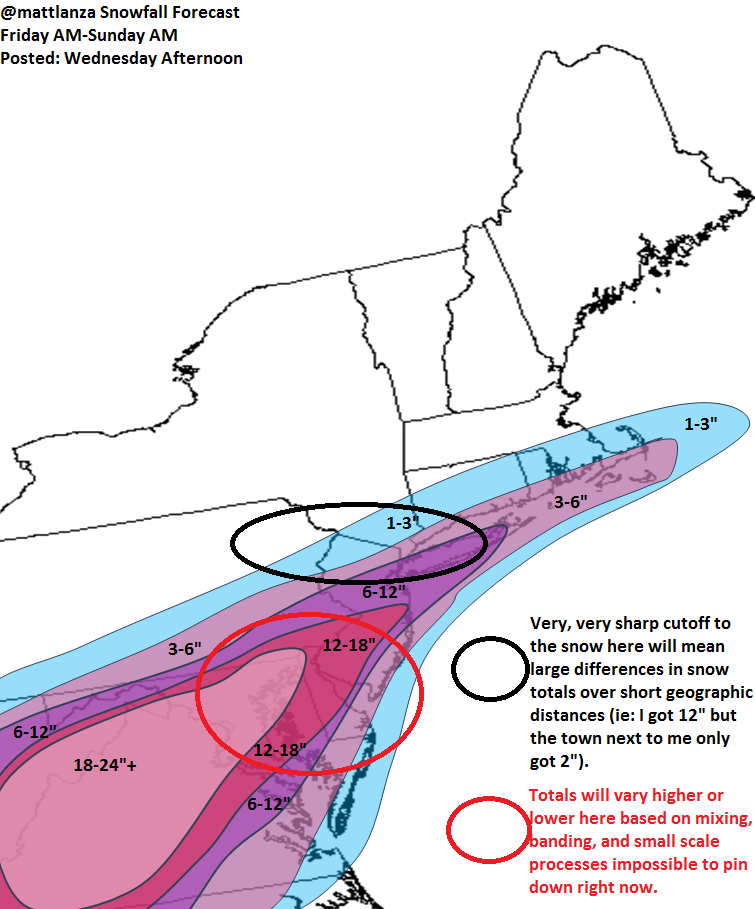
My snow forecast as of Wednesday evening. Not an official forecast, just my own opinion.
What do I think? Some key points.
The northern fringe of this storm is an absolute nightmare. If you live north of I-195 in NJ or I-76 in PA, this is going to be an incredibly difficult forecast to peg down. The tight gradient in snowfall that I spoke of yesterday is going to wreak havoc. A 20 mile shift in track of the storm (highly possible) could lead to a 6-12″ difference in snow totals, if not more. This is going to be a big problem for North Jersey, possibly the Harrisburg metro area, New York City and extreme southern Connecticut/Long Island.
The Jersey Shore is oscillating between a total mix scenario and a thumping snow. I don’t think this is like the storms of 2009 and 2010, where coastal South Jersey absolutely raked in snow totals. This will be more complex, and I’ve cautiously gone about 3-6″ there, but I do see risk for higher amounts depending on the exact final track.
The thump zone for this will be Northern/Western Virginia through DC and Baltimore. While I don’t expect a uniform 18-24″ in that zone, I do expect some locations to push 30″, contingent on mixing and thunderstorm potential. Other areas will see less than 18″. That’s the nature of snowstorms like this.
Yes, thunder is going to be likely from VA through NJ with this I think.
Winds of 30-50 mph are likely, and some gusts could be even stronger. This will create blizzard conditions. I would not be shocked to see Blizzard Watches expanded tomorrow.
Anything else I should know?
Snowstorms are fun. This one is going to be big, massive, and historic. While fun, it has a very serious element to it that should be respected. If you have plans on Saturday, I would strongly consider rescheduling them. Heed the warnings from NWS. They’re not just throwing this stuff out there. It’s serious.
And please consider taking pictures of something other than your patio furniture. Seriously. Get creative!
One of my favorite things to do after a snowstorm is to look and see where the most challenging gradient of snowfall occurs…in other words, the greatest change in snowfall totals over the shortest distance. This storm provided another good lesson in that. Check out the map below. I’ve plotted some select snow totals from the Mount Holly and Upton CWA’s from the event for Orange County, NY, and Sussex, Warren, Hunterdon, Somerset, Middlesex, Union, Essex, Morris, and Passaic Counties in NJ. Location on the map is approximate, and you can enlarge the map by clicking on it:
Check out some of the disparities. In one instance you go from 22″ to about 11″ over the course of *maybe* 10 miles. In the most extreme instance, Pottersville, NJ in extreme NW Somerset County reported 4.5″ (NWS Co-Op site). Elizabeth, NJ near Newark Airport in Union County reported 32.0″ (trained spotter). The distance between both locations is approximately 30 miles as the crow flies. That’s incredible. It’s common though. In snowstorms, especially ones of this intensity, you get intense areas of what we call mesoscale banding…bands of extremely heavy snow (sometimes with thunder) that impact small areas. To take this to another level, which I won’t do, you can also have something known intriguingly enough as “CSI,” or conditional symmetric instability…or slantwise convection. You often get this in intense snowstorms. I won’t bore you with details right now, but if you’re interested, a whole website is devoted to the topic here. It will be interesting to see the number of papers that I’m sure will come out in a year or three about this storm and the ones of last winter. Anyway, this basically means, some areas get absolutely walloped, while others get shafted.
Anyway, back to the topic at hand, you could probably replicate a map like this across southwest NJ and in parts of New England too. But this just goes to show you, for meteorologists making a snowfall forecast map, these are some of the complexities that we all have to deal with.
Lastly, the poll question continues. Do you all prefer the current system of occasional blog posts, or would you rather have occasional blog posts and a Facebook “like” page with occasional links/discussion/question areas? Vote below, and we’ll see where this goes.
So not everyone loves snow. As a meteorologist, even if I dislike dealing with it (working four years in lake effect country will do that to you), I love the unique quality of events like this and appreciate what has to come together atmospherically for something like this to happen. It’s not THE perfect storm, but it’s one of the most perfect storms. But some people can’t deal with it, hate it, curse it, etc. And that’s fine. So I dedicate most of this post to you.
At least temporarily, there’s going to be a pattern change in the East. Once the energy and upper level trough from this storm lifts away, we’re finally going to see some changes to allow the seemingly endless cold in the East to abate. Strong troughing is going to build into the West as the pattern sort of blocks up out here (a couple cutoff lows to allow for some of the coldest dry weather we’ve had here in some time). This will help allow a ridge to pump up in the East. There are still some questions as to how strong the ridge in the East will get and how long it will last, but at least as we go into the New Year, things begin to quiet down and thaw out a bit…and a lot of the snow that’s falling will be long gone. Enjoy it while you have it. The map to the left above, from http://raleighwx.americanwx.com, shows the average 850 mb temperature anomalies off the GFS model 6-10 days from now. It’s not a perfect representation, but you get the idea…cold West, warm East. It’s somewhat of an odd pattern, and truthfully, given the fact that blocking in the Arctic and Greenland wants to hold on, I don’t know how long it will last. But it is more “normal” for a La Nina pattern, at least temperature wise.
So truly an awesome storm unfolding. Storm totals are outrageous, 12-20″ widespread from Norfolk, VA-New England, and 6-12″ in parts of interior VA/NC, and even 1-3″ or so on the Outer Banks! It snowed as far south as Savannah, GA and Jacksonville, FL this morning. Pretty remarkable. I may do a wrap up post later, but pass on your totals if you’ve got them in your backyard!
Lastly, I’m curious if people are content with this format of either RSS/Google Reader, getting a link on Facebook, or email subscribing…or if you’d also like see a Facebook “Like” page for more short-form updates before and during events and occasional links of interest. Vote below and we’ll see what sorts of changes we can make.
Also, enjoy this video of the blizzard from NYC, including thundersnow around 1:45-1:50:
Well, it’s underway, and miraculously, there haven’t been any dramatic changes in the forecast in the last 12 hours. The main areas of concern to me seem to be:
Cape Cod/Providence/Boston/Long Island: How much falls as sleet/rain vs. snow, thus cutting down snow totals there. The low should ride the coast from about Montauk to Martha’s Vineyard, so this will both lead to a mix/changeover scenario on Cape Cod/southeast Connecticut/Rhode Island and may even have to a dry slot cutting down totals in general. Will this make it as far north as Boston? Doubtful, but we’ll see.
Jersey Shore from LBI south: There could also be some mixing issues here. In my experience there are almost always mixing issues in this region when a low passes this close to the coast. So this may cut down totals, and I’ve lowered the range a little to 7-14 (down from 8-16). It’ll still be a good storm, but the combination of a little less precip and this mixing scenario has me cutting back a smidge.
Philly-Morristown-Albany: The biggest question of all is regarding how far west the heavy snow will get. And this corridor stands the most to gain or lose depending on the exact amount the precip shield barges inland. I could see this being as little as 6″ in Philly to as much as 12-16″ there depending on the exact track (same goes for the I-287 corridor in Jersey and I-87 from Newburgh to Albany.
NYC-Hartford-Interior New England: This could be an absolute wallop for places like Worcester, the Berkshires, the Litchfield Hills, etc. A lot of potential for a lot of snow in these areas, and there could be a cluster of significant 20″+ amounts anywhere between NYC and Boston depending on where the best mesoscale banding sets up.
Lastly, the wind impact from this cannot be stated enough. This is a storm which is going to see its barometric pressure fall from about 996mb off Cape Hatteras to perhaps 970 mb or lower south of Long Island. In meteorological terms, we call this an atmospheric “bomb.” In other words, it’s going to be rapidly deepening, and it will be progressing along close to shore. This is going to create absolutely ferocious winds all the way up the coast and rather far inland. With everyone’s Christmas lights up, coupled with heavy snow, the wind has the potential to cause a LOT of damage/mess. It may not be a bad idea to secure some of the holiday displays Sunday morning. There will also be the potential for significant power outages as well, so be prepared, especially because temperatures will drop into the low 20s to teens Monday night and Tuesday morning, with wind chill on top of that.
Travel is going to be next to impossible and is not recommended, especially from Northeast NJ into New England after about 9 AM-Noon tomorrow. And it may be that this is the case throughout most of eastern PA/NJ/DE/eastern NY as well. This really to me seems like last February, shifted a couple hundred miles further north. So please use caution if you have to travel, and be prepared for numerous road closures/states of emergency by Sunday evening.
7:30 AM Sunday Update: I would likely trim some of the snow totals back east a bit in the 3-7″ range, esp in NY/PA. The storm is moving along at a decent clip. The real intensification takes place this evening…that’s when the “blizzard” aspect will begin to take shape. In terms of the actual amounts, I might be apt to trim back south Jersey/Delaware a bit (more like 6-12 now to me). Overnight models (not going to read into them too much at this point) did cut back snow totals there to the 6-10″ range). Still looks good that the bullseye is between NYC and Boston..but not IN NYC or Boston. Boston may end up on the lower end of my forecast range, but inland areas will push the higher end. The western extent of the snow between the Delaware River and the Hudson River is going to be EXTREMELY sharp now it appears. Could easily go from 2-4″ far west to 12″+ over a very short distance. Whether that gradient is centered over the Delaware Water Gap or Denville in North Jersey, I’m still not sure. Still a tough forecast. Keep an eye on things throughout the day. Also, from northeast NJ into New England, the bad travel may not start until more like 11-2, rather than 9-12.
1:30 PM EST Update: Everything still on track. Morning model guidance and current radar trends validating a major storm that’s underway. Latest SPC Mesoanalysis showing that the storm is rapidly deepening off the NC coast as it gradually pulls north. This will bring blizzard conditions to most of coastal NJ/Delmarva and inland to about Rt. 206. The blizzard conditions will spread north into NYC and New England this evening. The worst of the weather will be bounded on a line south of I-90 in New England and east of I-287 in NJ-I-87 in NY.
If you live in Southeast Jersey, snowfall rates of at least 1″/hour are occurring and those heavier bands will continue to push onshore from time to time this afternoon and evening. Heavier snow continues to gradually push inland, and to be honest, the snowfall map from last evening doesn’t look too bad at this point (though I’d still shift the 4-8″ area a little further east). Some totals so far include Somers Point at 6″, ACY at 4.3″, a little over 3″ at Ocean City, MD, and 6-10″ in the Hampton Roads area of Southeast VA and parts of Northeast NC, back through Raleigh/Durham. The DC/Baltimore areas have been for the most part “shut out” of the storm so far, and it’s not looking likely that those areas will be hit nearly as hard as others north and east.
Travel and conditions in general will continue to deteriorate this afternoon. Be safe!
Here’s your map for new snow tonight-Monday (click to make it bigger). Feel free to add any questions in the comments, and if you like the updates or have any comments/ideas for future items, let me know! And Happy Boxing Day!
Final Snowfall forecast for Boxing Day Blizzard (click to enlarge)
The storm is moving along at a decent clip. The real intensification takes place this evening…that’s when the “blizzard” aspect will begin to take shape. In terms of the actual amounts, I might be apt to trim back south Jersey/Delaware abit (more like 6-12 now to me). Overnight models (not going to read into them too much at this point) did cut back snow totals there to the 6-10″ range). Still looks good that the bullseye is between NYC and Boston..but not IN NYC or Boston. Boston may end up on the lower end of my forecast range, but inland areas will push the higher end. The western extent of the snow between the Delaware River and the Hudson River is going to be EXTREMELY sharp now it appears. Could easily go from 2-4″ far west to 12″+ over a very short distance. Whether that gradient is centered over the Delaware Water Gap or Denville in North Jersey, I’m still not sure. Still a tough forecast. Keep an eye on things throughout the day.
Snow Totals Map for Southeast Minnesota and Western Wisconsin - courtesy of NWS Minneapolis/St. Paul
Well, after all the talk about the chance of snow for this weekend in the interior Northeast, it turned out to be mostly just model error…but kudos to the European model which did a fairly decent job in calling that this would mainly be a Lakes/Midwest beast. Something is just inherently wrong with the GFS that it can’t handle certain things well…especially interesting considering the ensemble track was south and east even of the model. Let’s discuss what’s up.
First the blizzard. Just massive. Most of you know about the Metrodome roof collapsing under the snow (not unprecedented, but they aren’t going to have that place ready for a game tomorrow). More details on the storm’s impact in Minnesota here.
Storm totals were as high as 23″ in Polk County, WI, 21.5″ in New Market and Shakopee, MN, 21″ at Oakdale, MN, and 20″ at Red Wing and Maplewood, MN.
Blizzard Warnings remain in effect today from eastern Iowa to the NW suburbs of Chicago and Milwaukee and N Michigan. Winter Storm Warnings are posted for Wisconsin, Illinois, Michigan, parts of Ohio, and the Appalachians from PA to Tennessee. And Winter Weather Advisories are posted all the way into far N Alabama and Georgia! On top of that, freeze and wind chill warnings/advisories are posted for the Deep South all the way into southern Florida, where nighttime lows early this week are going to rival what we saw back in January. Another round of lake effect snow is going to hammer Central and Western New York again this week (though to me the trajectory looks a little more northerly than what occurred last week, which would mean less snow for places like Syracuse). But we’ll see.
Overall, winter is in force in the Eastern US. At the same time, we’re going to break record highs today across SoCal, with widespread mid 80s expected. Amplification…what goes up must come down…strong, deep trough in the East = strong ridge in the West usually. And we are in an extremely amplified pattern…and the anomalous nature of this amplified pattern is going to remain in place for the foreseeable future. That means more fun to come.
So what do I think is to come?
We have a couple systems to watch. With extreme blocking in place, the storm track is going to look a lot like last winter. One weak wave looks to pass through the southern US Wednesday night-Thursday night. It’s a flat wave though, so I question if other than some nuisance freezing rain or sleet if it will pack much punch. It will serve though to reinforce the cold over the East for next weekend.
CPC Graphic Showing Ensemble Forecast of Arctic Blocking
A more important storm is evident on the European model for the end of the weekend or early next week. This shows a more amplified storm, which if taken literally, shows a substantial snow chance from the Carolinas to DC and possibly into New England. The GFS isn’t showing much other than a cold pattern right now and keeps everything offshore (not uncommon for this model to miss a feature like this though). I am getting somewhat on board for at least the threat of a snow/winter weather event in the Mid Atlantic and possibly the Northeast next weekend or early Christmas week.
The pattern is active later this week with a 140+ kt jet stream pointed right into California. This isn’t too unlike what we saw a lot of last winter in the active El Nino pattern. Whether this is too far north or not, I guess we’ll see, but with a load of blocking in Arctic/Greenland and a load of moisture/energy slamming into the West Coast…that to me suggests someone in the East is in for it at some point. It still could track out to sea…it still could track inland…it may be the model misleading us. But it’s evident that the weather pattern is much more intriguing than it has been. We’ll watch this week and see!
Couple things to round this out…
First, if you missed it at all, here’s the incredible video of the Metrodome’s roof collapse in Minneapolis:
Well, after all the talk about the chance of snow for this weekend in the interior Northeast, it turned out to be mostly just model error…but kudos to the European model which did a fairly decent job in calling that this would mainly be a Lakes/Midwest beast. Something is just inherently wrong with the GFS that it can’t handle certain things well…especially interesting considering the ensemble track was south and east even of the model. Let’s discuss what’s up.
Blizzard Warnings remain in effect today from eastern Iowa to the NW suburbs of Chicago and Milwaukee and N Michigan. Winter Storm Warnings are posted for Wisconsin, Illinois, Michigan, parts of Ohio, and the Appalachians from PA to Tennessee. And Winter Weather Advisories are posted all the way into far N Alabama and Georgia! On top of that, freeze and wind chill warnings/advisories are posted for the Deep South all the way into southern Florida, where nighttime lows early this week are going to rival what we saw back in January. Another round of lake effect snow is going to hammer Central and Western New York again this week (though to me the trajectory looks a little more northerly than what occurred last week, which would mean less snow for places like Syracuse). But we’ll see.
Overall, winter is in force in the Eastern US. At the same time, we’re going to break record highs today across SoCal, with widespread mid 80s expected. Amplification…what goes up must come down…strong, deep trough in the East = strong ridge in the West usually. And we are in an extremely amplified pattern.
What’s to come?
We have a couple systems to watch. With extreme blocking in place, the storm track is going to be pushed further south. The classic, “it’s too cold to snow” pattern for much of the north. One weak wave looks to pass through the southern US Wednesday night-Thursday night. It’s a flat wave though, so I question if other than some nuisance freezing rain or sleet if there will be any real wintry precipitation anywhere with it. It will serve though to reinforce the cold over the East for next weekend.
A more important storm is evident on the European model for the middle of week two (Christmas week). This shows a more amplified storm, which if taken literally, shows a substantial snow chance from the Carolinas to DC. The GFS isn’t showing much other than a cold pattern right now. I am getting somewhat on board for at least the threat of a snow event in the Mid Atlantic next week sometime. The pattern is active later this week with a 140+ kt jet stream pointed right into California. This isn’t too unlike what we saw a lot of last winter in the active El Nino pattern. Whether this is too far north or not, I guess we’ll see, but with a load of blocking in Arctic/Greenland and a load of moisture/energy slamming into the West Coast…that to me suggests someone in the East is in for it at some point. We’ll seeWell, after all the talk about the chance of snow for this weekend in the interior Northeast, it turned out to be mostly just model error…but kudos to the European model which did a fairly decent job in calling that this would mainly be a Lakes/Midwest beast. Something is just inherently wrong with the GFS that it can’t handle certain things well…especially interesting considering the ensemble track was south and east even of the model. Let’s discuss what’s up.
Blizzard Warnings remain in effect today from eastern Iowa to the NW suburbs of Chicago and Milwaukee and N Michigan. Winter Storm Warnings are posted for Wisconsin, Illinois, Michigan, parts of Ohio, and the Appalachians from PA to Tennessee. And Winter Weather Advisories are posted all the way into far N Alabama and Georgia! On top of that, freeze and wind chill warnings/advisories are posted for the Deep South all the way into southern Florida, where nighttime lows early this week are going to rival what we saw back in January. Another round of lake effect snow is going to hammer Central and Western New York again this week (though to me the trajectory looks a little more northerly than what occurred last week, which would mean less snow for places like Syracuse). But we’ll see.
Overall, winter is in force in the Eastern US. At the same time, we’re going to break record highs today across SoCal, with widespread mid 80s expected. Amplification…what goes up must come down…strong, deep trough in the East = strong ridge in the West usually. And we are in an extremely amplified pattern.
What’s to come?
We have a couple systems to watch. With extreme blocking in place, the storm track is going to be pushed further south. The classic, “it’s too cold to snow” pattern for much of the north. One weak wave looks to pass through the southern US Wednesday night-Thursday night. It’s a flat wave though, so I question if other than some nuisance freezing rain or sleet if there will be any real wintry precipitation anywhere with it. It will serve though to reinforce the cold over the East for next weekend.
A more important storm is evident on the European model for the middle of week two (Christmas week). This shows a more amplified storm, which if taken literally, shows a substantial snow chance from the Carolinas to DC. The GFS isn’t showing much other than a cold pattern right now. I am getting somewhat on board for at least the threat of a snow event in the Mid Atlantic next week sometime. The pattern is active later this week with a 140+ kt jet stream pointed right into California. This isn’t too unlike what we saw a lot of last winter in the active El Nino pattern. Whether this is too far north or not, I guess we’ll see, but with a load of blocking in Arctic/Greenland and a load of moisture/energy slamming into the West Coast…that to me suggests someone in the East is in for it at some point. We’ll see
Map of National Weather Service Watches/Warnings/Advisories, November 22nd.
Lots to hit on tonight. The map to the left is the NWS map of watches, warnings, advisories, etc. Just a royal MESS in the West right now. But this is really a phenomenal storm. I give the West a lot of flack for having relatively boring weather overall, but when things like this happen, it’s pretty darn neat. This is round two of wild western weather. Round one is now in the Midwest (more on that in a minute). Let’s go west to east and look at some of what’s going on.
First up, in Alaska, the Fairbanks area (remember they were recently breaking fair weather records) is getting rocked by an ice storm, which is considered “unprecedented” by local standards. According to The Weather Channel’s Stu Ostro, the precipitable water measured at Fairbanks (which is just essentially a measure of how “juicy” the air mass is…measured in inches) came within 0.01″ of setting a November record for that area. These are things you don’t often see in Alaska this time of year. But I think this speaks to the amount of blocking that’s setting up in North America, which is going to make for a very intriguing couple of weeks across the continent.
Next, down south to Seattle. 2.0″ of new snow fell at Sea-Tac today, which is a record for the date, breaking the old record of 1.5″ in 1977. It’s the snowiest November day in Seattle in 25 years, and marks only the 6th time in November since 1948 that Seattle has accumulated 2″ or more. Snow wreaks absolute havoc on Seattle. Here’s all the latest news from the Emerald City. Closed roads because of ice, including some major ones, a 747 cargo plane slid off the runway at Sea-Tac, and Snoqualmie Pass and I-90 is chains only. Down the road in Portland, not as much snow, but they are also expecting some bitter cold, with temps getting to or below freezing tomorrow and overnight lows dipping into the teens.
National Weather Service Description of Blizzard Impacts in Spokane, WA and Adjacent Idaho
Inland from there, blizzard warnings are flying for much of eastern Washington, including Spokane, as well as northern Idaho. The map to the right is the NWS in Spokane’s description of how events should unfold tonight. The latest on news from Spokane is here. I don’t want to say this whole storm caught people by surprise in the Northwest. Much was known about it coming in, but it did get a little stronger than expected, so the impression of a “surprise” exists. Forecasting in the West is extremely difficult sometimes.
from the weekend were exceedingly impressive. Here’s a recap from the NWS in Reno, NV:
So those are some crazy totals (specifically the 81″ atop Mammoth!). So how much new snow? Looks like an additional 1-3 feet above 4,000′ seems likely in the Sierra, and it’s likely places like Mammoth (up around 11,000′) will exceed 100 inches for 5 day totals.
Record low temperatures will build in behind this next front..just brutally cold in the interior. Even the potential for a widespread frost or freeze in the San Joaquin Valley…the agricultural capital of America. Here’s a brief article on how farmers will handle it.
Storm Prediction Center Radar, Surface, and Watches Map
As we move into the Midwest, the weekend storm that hammered the West has moved in and is creating some very intriguing severe weather…almost like springtime! So far, seven reports of tornadoes have been received from Illinois and Wisconsin, and with a wide area of watches in effect and a potent late autumn cold front moving through, I think we’ll see a few more isolated reports of tornadoes, but more than likely a lot of reports of damaging winds. The upper level support helping to fuel this mess will gradually diminish as we go into tomorrow, so as the front slides to the south and east, we won’t see quite the active severe weather day tomorrow.
In the meantime, here’s a radar capture from Chicago, IL earlier today, showing some of the supercells that had formed in that area and had recently produced tornadoes west of the city.
Those storms produced this tornado:
So all in all, extremely active today across the western two thirds of the country.
What a storm it was for sure. It looks like the lowest pressure was around 28.20″, or 954.96mb, recorded at Orr and Bigfork, MN. This blows away the previous mainland US record set in Cleveland, OH in 1978 of 28.28″ or about 958 mb. In terms of the damage, yesterday alone had 287 wind reports and 24 tornado reports. The previous day had about 150 wind reports (a lot though from another system in the Carolinas) and one tornado report. So, all in all, it looks like we probably ended up with close to 400 wind reports and 25 tornadoes from this storm in the Midwest, which is remarkable. Lots of links on this one:
SPC Mesoanalysis for 10/26/10 at 5 PM Central Time, near the peak of the storm.
The highest confirmed wind gust I can find is about 77 mph in Greenfield, IN. In addition to all the wind and storminess, there’s also the snow aspect of this storm! As with most fall storms, this one dragged down some cold air, enough to change any liquid to snow in the Dakotas and Minnesota. Thus far, Harvey, ND is the champ with 8″ of snow. Duluth, MN isn’t far behind though with 7.4″. Blizzard, High Wind, and Winter Storm Warnings continue today for much of the Upper Midwest.
The strong winds also helped to change the lake level of Lake Michigan, with westerly and northwesterly winds shifting water from the Illinois/Wisconsin side to the Michigan side. This is actually not terribly uncommon, but still pretty cool. I recall several instances of this happening on Lake Erie when I worked in Upstate NY.
As is always the case with almost any record, there will be claims, disputes, etc. that, “Well, it’s not REALLY the record.” And of course, this time around, we have that as well. Folks in the Northwest are amused by the shock and hype of this storm in the Midwest…because storms such as this routinely impact them every winter. They’ve got a good point, as some of the pressures measured in past winter storms there (specifically one in 1995 measured at 958 mb, not even near the center of the storm) have indeed been routinely close to some of the “record” readings.
That all being said however, the truth is that in terms of actual measurements on land in the lower 48, away from the East coast, this storm is currently king. But I’m sure one day, with better monitoring now in place in the Northwest, we’ll shatter this record as well.
250 mb Wind Anomalies in Recent Strong La Nina Autumns
It’s not uncommon during La Nina autumns to see massive storms spin up in the Midwest, Lakes, and Plains, thanks in part to a raging strong jet stream coming out of the Pacific Ocean. If you click the map to the left, you can see a composite of the anomaly of 250 mb wind speeds (basically how much stronger or weaker than normal the jet stream winds are) in some recent stronger La Nina autumns, similar to this one. So it’s pretty obvious that this is somewhat normal. What isn’t normal is how much of a beast this storm is.
Yesterday we talked about this storm “bombing” out, which it appears to have done by definition (at least a 24 mb drop in 24 hours). It is now to the point where both state records for lowest barometric pressure have been set in Minnesota and Wisconsin. The previous record in Minnesota was set during a similar fall storm in November of 1998. According to the National Weather Service in Duluth, Aitkin, MN dropped to a barometric pressure of 962.3 mb or 28.42″Hg. The previous state record was 962.6 mb at Albert Lea, MN during that November 10, 1998 storm. In Wisconsin, Superior hit 28.38″Hg or 961.06mb. The previous record there was 963.43 mb in Green Bay in April of 1982.
As of this writing, both Orr and Bigfork, Minnesota are sitting at 28.24″Hg or 956.32mb. If this is verified (and it will likely go even lower in some other parts of Northeast Minnesota), this would break the all-time United States low pressure record for a non-tropical cyclone. The old record of 28.28″Hg was set in Cleveland, OH during the Blizzard of 1978 (and naturally, the Wikipedia article is already up to date with this information!).
Edit to add: 28.22″ as of 3:30 Central time, or 955.6 mb…both at Orr and Bigfork.
National Radar Composite from Late Tuesday, image from NCAR.
So this is truly an historic storm…and one that is not just setting records, it’s causing mayhem! Blizzard Warnings for the Dakotas, literally dozens of tornado warnings in the Midwest and Southeast, numerous tornado watches (5 currently from Mississippi to Southwest NY), widespread wind damage, and quite a change in the weather overall. We had a somewhat rare “High Risk” for severe weather issued this morning by the Storm Prediction Center. So far, there have only been 11 reports of tornadoes, however there have been over 150 reports of strong winds or wind damage thus far, and that number is only going to continue going up.
I’ll try and recap some of the damage reports and more tomorrow.
The CIMMS Satellite Blog, as always, does a bang up job (and will likely add more in the coming days) with some imagery from this storm.
Sadly (from a weather junky’s standpoint), the Weather Channel appears to be headed down the road of the rest of cable TV…just when it seemed they were getting back on track. Unfortunately, this is what drives ratings, so they will continue to follow the blueprint until it fails.