El Nino Rains: Comparing 2015 so far to other beasts of the past

The fever pitch of El Nino headlines and articles isn’t slowing down. In fact, it’s only growing:

El Nino Fever Pitch

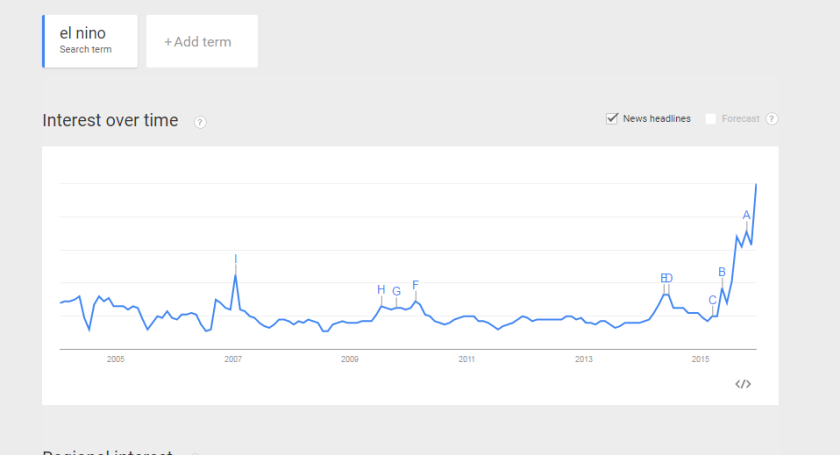
It comes mostly with speculation, preparation, and wonder. Some of the headlines are ridiculous (just go back through photos on my Twitter timeline). Most are reasonable. But it’s news. And it’s clearly a high impact weather phenomenon.

So it begs the question: How’s it doing? Is El Nino behaving like it’s supposed to? Specifically with regard to rainfall. Remember, this El Nino event is a strong one. In fact, it’s the strongest since 1997, and in some respects, it may be the strongest on record. So we have a pretty clear set of analogs to look at and see if this year fits the mold.

Judging by the temperature forecast for the next 10-15 days, the pattern seems to be mostly behaving like a strong El Nino should in December. How about rain? Let’s look back at other actual strong El Nino events and see where 2015-16 is falling relative to those events, specifically in terms of rainfall.

A caveat here: Remember, it’s early. Winter is a marathon, not a sprint. Because something looks one way on December 8th, doesn’t mean one month from now we’re going to be in the same boat. But there are a few interesting nuggets to pull out of this, and I think it’s mostly a good idea to give people some perspective on certain story lines.

Just as a note, my definition for “strong” El Nino events was using a blend from Jan Null’s list post-1950 and Klaus Wolter’s list pre-1950, as well as some “artistic liberty.” Not everyone agrees on the perfect definition of what a strong El Nino is, but hopefully I captured the majority. I’m tracking rain from July 1-June 30.

Southern California

When people think of El Nino, many think of SoCal. You know, mudslides in Malibu, etc. I believe the mayhem of 1997-98 and subsequent personification by Chris Farley has set a level of expectations.

Thus far, 2015 is behaving pretty much about where other strong El Nino events have done in Los Angeles:

Los Angeles Rainfall

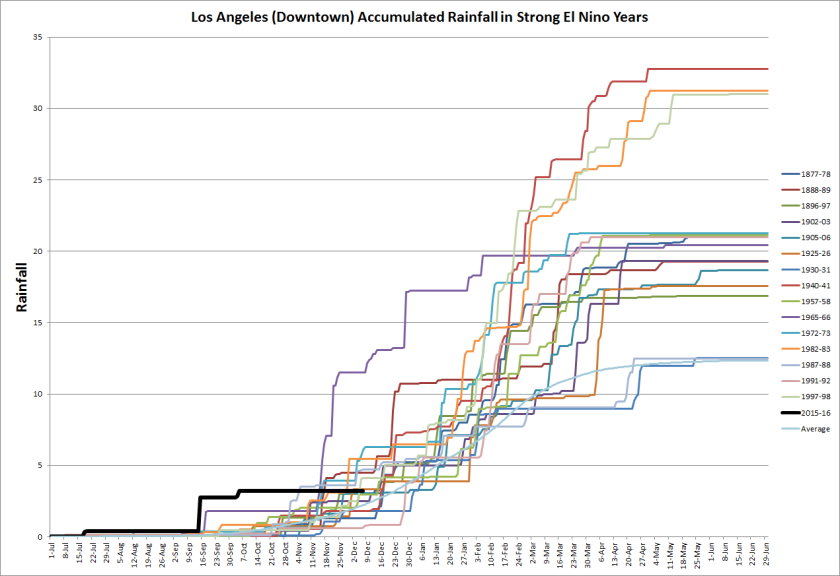
Every strong El Nino event back to the 1800s has had normal or above normal rainfall in Los Angeles. Thus far, thanks mostly to a freak wet event in early autumn, Los Angeles is indeed above normal. It is worth noting, that 2015-16 wouldn’t be the only strong El Nino year to see a “freak” early autumn rainfall event followed by a prolonged period of dryness into December. So if people are wondering where the rain is, wait a few more weeks. We are entering the ramp up period. If things don’t start picking up by late month, then we can start to worry.

Northern California

Northern California is a conundrum during strong El Nino events. Historically, San Francisco is split between above and below normal rainfall, so it’s tough to say too much at this early stage. That said, it is worth nothing, that as of right now, this El Nino is on the lower end of the envelope in terms of rainfall in strong El Nino events in the Bay Area:

San Francisco Rainfall

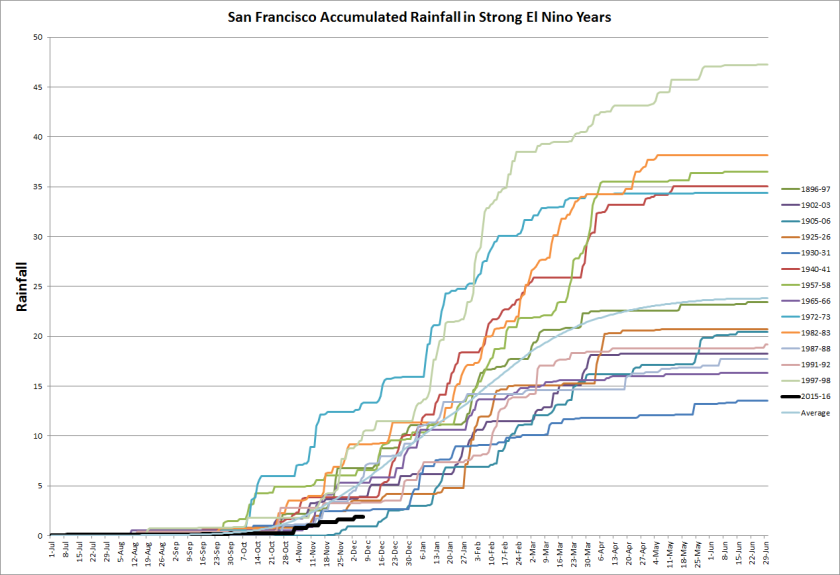
Like Los Angeles, it’s still early. The ramp should start soon if we’re going to go above normal, so again, if things don’t perk up by late December, it might be time to plan on a normal or drier than normal winter at best.

Washington/Oregon

This is where it gets interesting. For the most part, the El Nino signal in the Pacific Northwest is somewhat mixed. You get dry years and you get wet years. Usually, however, you don’t have a super wet year when there’s a strong El Nino.

In Portland (where the data is only available back to the 1957-58 El Nino) no strong El Nino has been wetter than normal. Seattle is mixed from slightly above normal to way below normal. So far in Seattle? It’s the wettest strong El Nino to this point on record, and it’s not even close. This autumn has been incredibly wet so far.

Seattle Rainfall

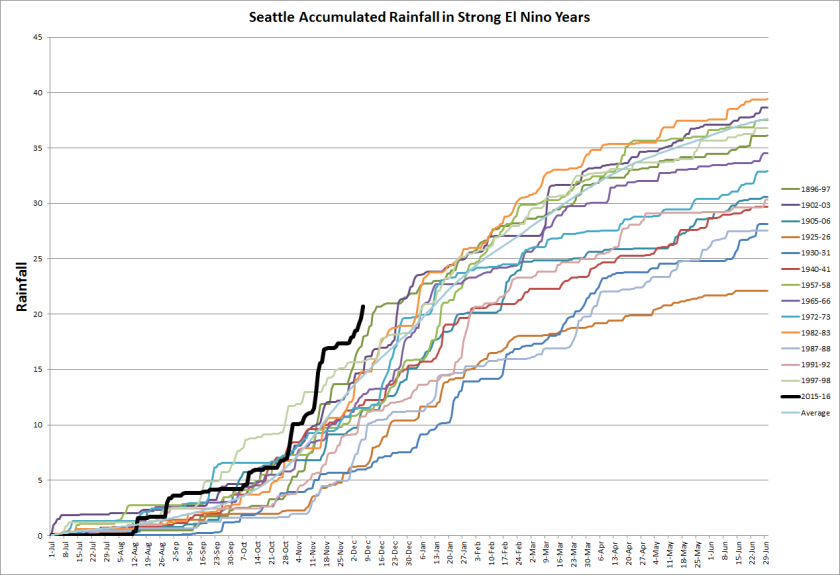
If we keep up at this rate (and the current forecast implies this), this will quickly become one the wettest, if not the wettest strong El Nino event on record in Seattle.
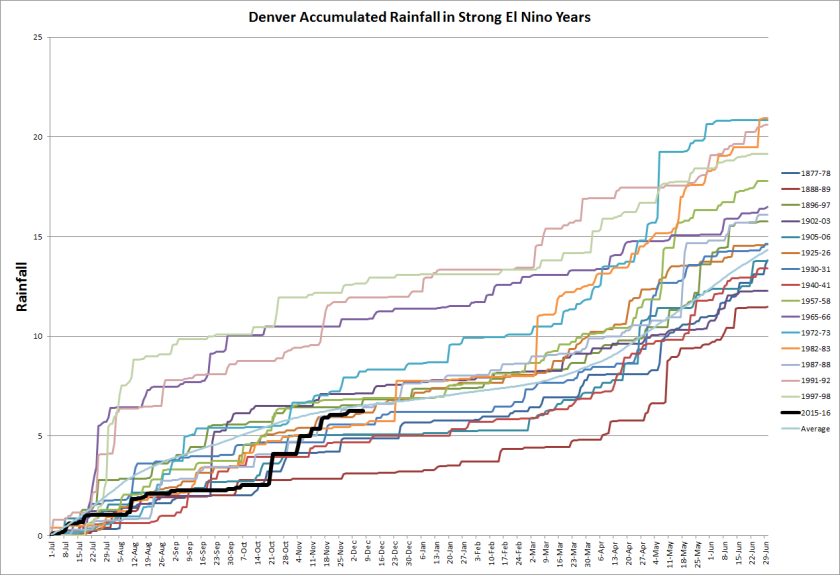
Great Basin/Rockies

In Denver, the bend is toward a wetter than normal outcome in strong El Nino years, but it is mixed. So far, Denver has been mid-pack for strong El Nino events.

Denver Rainfall.png

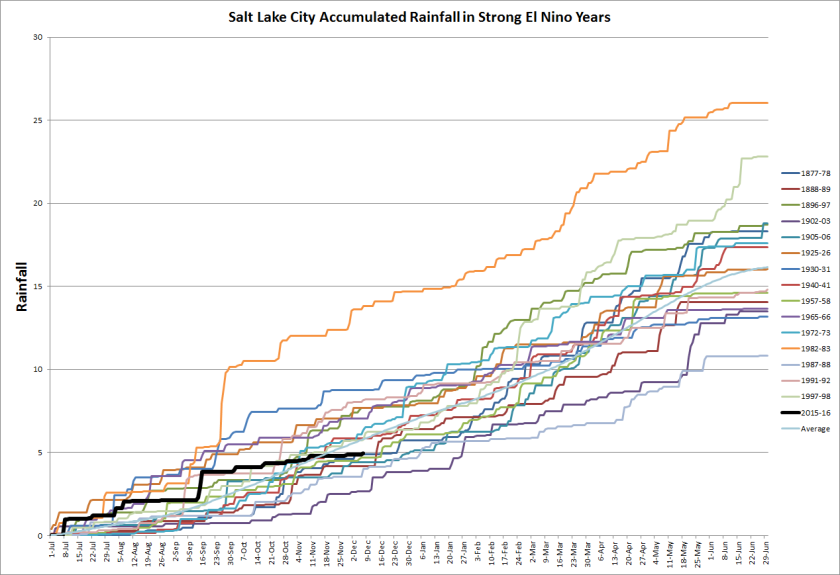
Salt Lake City is a bit more mixed, split almost evenly between wetter than normal and drier than normal (82-83 was a beast there). So far, we’re doing middle of the pack there also.

SLC Rainfall

It will be interesting to follow this as we go through the cold season. I’ll likely be tracking this, as it’s good to establish where this El Nino event falls. For everyone, it will probably be different. But thankfully we have a useful sample in a number of places to utilize.

Raleigh, Tuscaloosa/Birmingham, Joplin….Springfield, MA

2011: Raleigh, NC….Tuscaloosa and Birmingham, AL…Joplin, MO…Springfield, MA
1953: Flint, MI…Worcester, MA…Waco, TX

Not much to say about this…it was awe-inspiring to watch as it happened yesterday, and it happened in an area I’m very familiar with, so it hit close to home. But a couple words on it….

Tornadoes don’t have personality….they don’t pick and choose to destroy some houses and spare others. They don’t choose to form on certain days and choose not to on others. If the right ingredients come together over any given location, a tornado can develop. And in 1953 and now in 2011, it’s just so happened that several of the areas impacted by tornadoes have been large communities and unfortunately they’ve been large tornadoes in many cases.

Weather Scope App for iPad image of Doppler Velocity near Monson, MA

If Springfield, MA should teach you one thing, it’s this: It does not matter where you live or what you remember or were taught about the weather in your town: If the right set of ingredients comes together at the right time, a large, destructive tornado can develop and can do serious, life threatening damage. What you see on the left…that’s something straight out of the Midwest or Plains. But that’s over Massachusetts. It can happen to you, and yesterday is a textbook example of why you need to pay attention when warnings are issued. If you take one lesson from it…that’s the one.

In the end, I think we’re looking at a solid stripes of EF-3 damage in between widespread EF-1/2. The radar presentation of this thing was as good as anything I’ve seen this spring, and hands down the most well developed supercell I’ve ever seen on radar in the Northeast, so it has the potential to be an EF-4 in a few spots… especially near where this radar image was taken. It was at its best (worst) I believe between Monson and Southbridge. But we’ll see. NWS Boston won’t have an official answer until tomorrow it appears.

Pick of the Weekend

Just trying something new here. My pick of the weekend is the Pacific Northwest. After months of rain and misery, at least a couple nice days are on top with 80s likely in Portland Saturday and upper 70s in Seattle as well into Sunday. As long as the dry, offshore flow develops as expected, it could be a chamber of commerce type weekend in the Northwest. Long overdue!

—-

Find us on Facebook!

Hurricane Season Ends, European Chill, Cool Video, Quake Off Jersey

Well, I hope everyone enjoyed their Thanksgiving and holiday weekend, did their shopping, etc. Back in California after a fun leg of flights today over the large storm system swirling in the middle of the country. More on that shortly. First, let’s catch up on some of the more interesting stories from the last week or so…

2010 Atlantic Hurricane Season Storm Tracks - courtesy NOAA

2010 Atlantic Hurricane Season Ends

First and foremost, today is November 30th, which is the last day of the Atlantic Hurricane season. That isn’t to say more storms can’t form, but in terms of statistics, this season is done. How did we do?

19 Named Storms
12 Hurricanes
5 Major (Cat 3+) Hurricanes

Normal is 11, 6 and 2 respectively. Here’s the official NOAA press release on the season. The season ends up tied for the 3rd most active on record (1887, 1995), and it ties for the second most hurricanes on record (1969). The money quote from the release (in my opinion):

“Large-scale climate features strongly influenced this year’s hurricane activity, as they often do. This year, record warm Atlantic waters, combined with the favorable winds coming off Africa and weak wind shear aided by La Niña energized developing storms. The 2010 season continues the string of active hurricane seasons that began in 1995.

But short-term weather patterns dictate where storms actually travel and in many cases this season, that was away from the United States. The jet stream’s position contributed to warm and dry conditions in the eastern U.S. and acted as a barrier that kept many storms over open water. Also, because many storms formed in the extreme eastern Atlantic, they re-curved back out to sea without threatening land.”

KTRK-TV in Houston compares some of the seasonal forecasts.

Some more perspective on the season and hurricanes in general, including a neat satellite derived rainfall map from this season.

Overall,  I think this season is going to go down in the books as a bust in general, namely because the U.S. was spared a hurricane hit for the fifth straight year, despite the hyperactive nature of the season. But the forecasts were very well done for the most part this season, and frankly, I don’t know that you can ask for much more than that, given our limited ability to predict weather and climate.

So what about next year? It’s obviously way down the line and there’s little skill in trying to make a forecast this far out. But, if you look at a couple of key El Nino area forecast, the ECMWF and the IRI, both indicate (an implied and/or average) weak La Nina persisting into next summer. Should that hold together, that would be one factor that would would favor another busier than normal season. Whether it’s even remotely as busy as this year…or busy at all…remains to be seen though. But that just gives you an idea.

Lastly with the tropics, some new online maps are available, indicating flood vulnerability along the coast due to storm surge. If you click the link in the article and tool around with the maps, some of them are interesting. Bottom line, there are a LOT of vulnerable places on this country’s coast to storm surge flooding.

Mildly similarly related…

There was an interesting article published in Friday’s New York Times about how Norfolk, VA is handling frequent bouts of tidal flooding.

Some cool video came out of last week’s big Western storm. This video was courtesy of Dale Ireland in Silverdale, WA (originally published in Cliff Mass’ Washington weather blog). Then of course, there was this priceless video from Seattle last week:

Here’s a radar loop from the snow in Seattle last week as well:

That Seattle snow made it to Salt Lake City last Tuesday, and here’s some really cool time lapse video of the snow rolling in, and a slower video that shows basically a wall of angry weather arriving:

Interesting AccuWeather blog post today about how the West is seeing absolutely phenomenal early season ski conditions…some of the best in years. It has been stormy…and it’s also been cold, helping a lot of ski resorts add more white gold to their slopes. Absolutely great conditions out West this year. Here’s an article on how citrus growers in Central California have been protecting their crops.

Cold in Europe

This winter is behaving (in some regards) oddly similarly to last winter. If you remember last winter, the US and Europe had it especially rough. Well, Europe is off to the races this winter too.

A few inches of snow for London…and a lot of travel disruptions.

The snow is disrupting school and life in the UK.

This follows some of the coldest November temperatures on record in the UK over the weekend!

Sweden is also seeing some of their coldest November weather in years.

The Eastern US will taste some cold weather, sort of driven by similar factors (and relatively, not nearly as cold) as we go through the next ten days or so. The pattern will also be ripe for the potential for at least some snow. More on that in coming days.

A few final things today.

USGS "Did You Feel It?" Map from today's 3.9 magnitude earthquake off Long Island.

From the head scratch department, dust storms can occur in the Arctic…and there’s an interesting driver behind them.

A 3.9 magnitude earthquake occurred around 10:45 AM today, about 120 miles ESE of New York City. The details on the quake are here. A ton of “Did You Feel It?” reports were received by the USGS from Long Island, New England, and New Jersey. Anyone notice this today?

And finally, in what is the most painful story of the day, another tornado hit Yazoo City, MS this morning. If you recall, Yazoo City was hit by a devastating EF-4 tornado back in April that killed 10 and injured dozens. From what I’ve read thus far, there were six injuries from this morning’s storm. More details if I get them.

More on some of the upcoming weather in the next couple days as I get myself caught back up on things after the extended weekend.

The Wild, Wild West

Map of National Weather Service Watches/Warnings/Advisories, November 22nd.

Lots to hit on tonight. The map to the left is the NWS map of watches, warnings, advisories, etc. Just a royal MESS in the West right now. But this is really a phenomenal storm. I give the West a lot of flack for having relatively boring weather overall, but when things like this happen, it’s pretty darn neat. This is round two of wild western weather. Round one is now in the Midwest (more on that in a minute). Let’s go west to east and look at some of what’s going on.

First up, in Alaska, the Fairbanks area (remember they were recently breaking fair weather records) is getting rocked by an ice storm, which is considered “unprecedented” by local standards. According to The Weather Channel’s Stu Ostro, the precipitable water measured at Fairbanks (which is just essentially a measure of how “juicy” the air mass is…measured in inches) came within 0.01″ of setting a November record for that area. These are things you don’t often see in Alaska this time of year. But I think this speaks to the amount of blocking that’s setting up in North America, which is going to make for a very intriguing couple of weeks across the continent.

Next, down south to Seattle. 2.0″ of new snow fell at Sea-Tac today, which is a record for the date, breaking the old record of 1.5″ in 1977. It’s the snowiest November day in Seattle in 25 years, and marks only the 6th time in November since 1948 that Seattle has accumulated 2″ or more. Snow wreaks absolute havoc on Seattle. Here’s all the latest news from the Emerald City. Closed roads because of ice, including some major ones, a 747 cargo plane slid off the runway at Sea-Tac, and Snoqualmie Pass and I-90 is chains only. Down the road in Portland, not as much snow, but they are also expecting some bitter cold, with temps getting to or below freezing tomorrow and overnight lows dipping into the teens.

National Weather Service Description of Blizzard Impacts in Spokane, WA and Adjacent Idaho

Inland from there, blizzard warnings are flying for much of eastern Washington, including Spokane, as well as northern Idaho. The map to the right is the NWS in Spokane’s description of how events should unfold tonight. The latest on news from Spokane is here. I don’t want to say this whole storm caught people by surprise in the Northwest. Much was known about it coming in, but it did get a little stronger than expected, so the impression of a “surprise” exists. Forecasting in the West is extremely difficult sometimes.

from the weekend were exceedingly impressive. Here’s a recap from the NWS in Reno, NV:

 ...LAKE TAHOE AREA...

 HOMEWOOD...              59 INCHES
 TAHOE CITY...            36 INCHES
 SQUAW VALLEY USA...      48 INCHES
 SQUAW VALLEY (8000 FT)...67 INCHES
 ALPINE MEADOWS...        56 INCHES
 ALPINE MEADOWS(TOP)...   77 INCHES
 TRUCKEE...               36 INCHES
 NORTHSTAR...             61 INCHES
 TAHOE DONNER...          59 INCHES
 GLENBROOK...             18 INCHES
 DAGGETT PASS...          28 INCHES
 SOUTH LAKE TAHOE...      30 INCHES

 ...WESTERN NEVADA...

 CARSON CITY...           6  INCHES
 MINDEN/GARDNERVILLE...   12 INCHES
 FALLON...                3  INCHES
 RENO...                  2  INCHES
 RENO (NORTH HILLS)       4  INCHES
 STEAD...                 4  INCHES

 ...EASTERN SIERRA...

 CEDARVILLE...            16 INCHES
 SUSANVILLE...            4  INCHES
 PORTOLA...               16 INCHES
 DOYLE...                 3  INCHES

 ...MONO COUNTY...

 BRIDGEPORT...            6  INCHES
 LEE VINING...            12 INCHES
 MAMMOTH LAKES...         45 INCHES
 MAMMOTH MOUNTAIN(TOP)... 81 INCHES

So those are some crazy totals (specifically the 81″ atop Mammoth!). So how much new snow? Looks like an additional 1-3 feet above 4,000′ seems likely in the Sierra, and it’s likely places like Mammoth (up around 11,000′) will exceed 100 inches for 5 day totals.

Record low temperatures will build in behind this next front..just brutally cold in the interior. Even the potential for a widespread frost or freeze in the San Joaquin Valley…the agricultural capital of America. Here’s a brief article on how farmers will handle it.

In Salt Lake City, they are preparing for a blizzard as well as this system spreads East into the Rockies. Here’s an NWS briefing on the storm.

Storm Prediction Center Radar, Surface, and Watches Map

As we move into the Midwest, the weekend storm that hammered the West has moved in and is creating some very intriguing severe weather…almost like springtime! So far, seven reports of tornadoes have been received from Illinois and Wisconsin, and with a wide area of watches in effect and a potent late autumn cold front moving through, I think we’ll see a few more isolated reports of tornadoes, but more than likely a lot of reports of damaging winds. The upper level support helping to fuel this mess will gradually diminish as we go into tomorrow, so as the front slides to the south and east, we won’t see quite the active severe weather day tomorrow.

In the meantime, here’s a radar capture from Chicago, IL earlier today, showing some of the supercells that had formed in that area and had recently produced tornadoes west of the city.

Those storms produced this tornado:

So all in all, extremely active today across the western two thirds of the country.

A couple other quick links…

A summary of the 2010 hurricane season in the Atlantic…but a cool collection of satellite images from all the hurricanes.

An interesting article from the NY Times that explains how South Dakota has had a pretty terrible year weatherwise (you may need to login or register to read).

The blog will be heading on to Thanksgiving break like most of the rest of you. Heading back to visit family in the East. So have a wonderful holiday!

A Sierra Special!

Map of NWS Watches/Warnings/Advisories as of 5 PM Pacific, 11/19/10

Wanted to discuss what’s about to unfold in the Sierra-Nevada Mountains of California over the next couple of days. Now, the Sierra get rocked every winter…and sometimes they get mind boggling snow amounts. But for some reason, every time it happens, I’m always floored by the numbers and the forecast. The map at the left shows the mess in the West…winter storm warnings for the entire Sierra Crest, mountains around Los Angeles, as well as northern California, Lake Tahoe, Carson City, and Reno. I’d classify this storm as “fun.” Let’s discuss how some of this will unfold.

Here’s one of the best forecasts ever…for the High Sierra (~ 12,000′) , just northwest of Mammoth. That’s 64-88″ of snow. The NAM model has been especially aggressive with this system, bringing extremely high amounts of precip to the Sierra Crest during this event. Here are a few maps..

Saturday Morning

Sunday Morning

Monday Morning

The first wave/cold front pushes through tonight and Saturday morning, dropping a fairly heavy amount of precip (liquid) on the Sierra. The second wave/front swings through Sunday morning, with probably an equal or greater punch. Wave #3 moves through Monday morning and should just be the “insult to injury” system. You have to remember how California is geographically set up. You basically have an 11-13,000′ wall sitting in the middle of the state and this soaks up any moisture on  a westerly wind component, which just allows them to wring everything out in those mountains.

The NAM model is admittedly ridiculously aggressive with QPF totals over 6″ on the northern crest by Monday evening. Using a standard 10:1 ratio of liquid to snow, that’s 60″ or 5 feet. But you would assume the ratios would be much higher so…yeah, you do the math. The GFS is a little more tepid, spitting out 4″ at max over the northern crest and “only” about 2.5-3.5″ liquid in the rest of the Sierra. That still comes out to close to 60″ when you factor in higher ratios. So the Sierra, Tahoe, etc. will get pummeled in this one, with 2-4 feet of snow on average above 8,000′ or so and lesser amounts in the lower high terrain.

We’re not quite done yet, as that Monday storm may be a sneaky one for the Northwest and deliver snow to Seattle or the area around it…and with cold air locked it, snow levels will get awfully low! Then that storm will move into the Rockies and places like Salt Lake City may get pummeled on Tuesday. An interesting start to holiday travel week!

Hitting the Links

Today is the one year anniversary of the debacle known as “Climategate.” Dr. Judith Curry examines if the climate science community has learned anything from it. There are a few good links to some other articles on the issue. Andy Revkin of the New York Times has a recap of what the last year has been like. While I don’t necessarily agree with how this was done, I think Climategate has done more good than bad for the long-term state of the science. It’s put things in perspective and helped curb the “science is settled” crowd to allow us to look at this with a wider focus before making economically destructive decisions. It’s re-opened a two sided debate and brought skeptics to the table. And that’s important for science.

Related: A departing Republican congressman from South Carolina fires a warning shot about dismissing climate change.

Eyjafjallajökull, the Icelandic volcano that messed up travel this summer, is the focus of a new paper in Nature that examines more about what was known about the volcano and what happened.

Today’s edition of the CIMSS Satellite blog shows ice and cold around Hudson Bay.

The Capital Weather Gang examines if the flood control plan being developed for a Flood Wall in Washington, DC is enough to do its job.

And from the photography side, time lapser Tom Lowe is putting together some truly beautiful and amazing scenes from the Southwest into a movie. Check out the site and some previews here. It really is some incredibly beautiful work.

Catching Up

Been out of town the last few days for a conference, so here’s a rundown of some things I’ve marked of interest. Plus we’ll talk about the weather for the weekend.


CIMSS Satellite Blog Capture of Satellite Loop/Lightning From Weekend Midwest Snow Blitz

So the Upper Midwest got absolutely spanked over last weekend. Just a massive snowstorm, even for that part of the country. Here’s some information on that storm.


The image on the right is courtesy of the CIMSS Satellite Blog, showing the development and movement of the storm as it lifted through the Midwest, along with lightning strikes. Thundersnow isn’t too rare or uncommon, but it still seems to be surprising when it happens. That usually means though that you’re dealing with a bigtime storm or some very heavy snowfall.  The storm set a few daily records at Minneapolis and Duluth. But the snow was quick to compress…it is still somewhat early in the snow season. Overall, the maximum totals looked to sit around 6-12″ in a band from Duluth back through MSP, Mankato, and down to the Iowa border.

The NWS in Minneapolis has a fantastic write up on the storm.

Another solid write up from the NWS in Duluth for Northeast Minnesota and Northwest Wisconsin.

Also a good write up from Minnesota Public Radio on some of the more unique aspects of this storm…particular the convective aspect, as well as the fact that temperatures were in a prime range for good accumulations.

Keeping on the topic of winter weather and convection: Big Sky Convection’s Dann Cianca has a good write up and very nice pictures from catching some convective snow in Denver on Tuesday.

Congrats to the Washington Post’s Capital Weather Gang for having the phrase “Snowmageddon” make the list of the top words of 2010. They were likely the original ones to coin this term. I’m not sure who coined “Snowpacalypse,” but while it was clever and useful for last winter, I hope this trend of coming up with clever catch phrases for every snowstorm stops. I’m still comfortable with “Super Bowl Snow” or “President’s Day Storm.” But in rare instances (and last winter was very rare), it’s manageable.

Shifting gears to climate stuff. Here’s the statement from Judith Curry for today’s Rational Discussion of Climate Change. The word is that the hearing was relatively uneventful, save for a few occasional heated discussions here and there. Setting the tone for the next couple years perhaps. More details and links for the testimony from the Dot Earth blog at the NY Times. So check that out if you have some interest.

A lot of times you’d think supercells were strictly an American thing. But you’d be mistaken. Check out some photos from this beauty off the French coast. The article is written in French, so if you don’t know French, oh well..the pictures tell the story.

As hurricane season winds down, Greg Nordstrom has a look at how the Accumulated Cyclone Energy (ACE) stacks up compared to some other hyperactive years. This year isn’t in the top 5, despite I think being there for actual *number* of storms. There was some pretty pathetic named storms this year (Nicole and Bonnie come to mind). Now, ACE is a decent gauge of a season or storm’s intensity, but it only factors in wind velocity and duration. We’ve learned in recent years especially that there is a LOT more to a hurricane than wind speed, pressure, surge, etc. Not all 125 mph storms are alike. So while this season may go down with the perception of sort of a bust (since the US was spared) and even ACE to some extent, this season was definitely hyperactive and worth the insane forecasts put out prior to the start of the season. I think we just simply dodged a bullet this year. It doesn’t make anyone more overdue or less overdue or anything…it just is what it is.

Here’s just a pretty simple overview as to why this may have been…sort of explaining how the pattern from last winter translated into what occurred this summer/autumn.

In the Northeast and Mid-Atlantic this morning, what a mess. Some crazy gusty winds, as well as tornadoes. A friend of mine had some family in and crazy pictures from the Town of Ghent in Upstate NY, which was hit by an EF-1 tornado. Wind gusts seemed to be widespread in the 35-55 mph range from Virginia up through New England. The wind did a lot of damage to an inn under construction in New Canaan, CT. The Trenton-Mercer Airport in Ewing, NJ was especially hard hit with a number of small planes that got flipped over. A link to The Trentonian here. This sort of thing is more common earlier in autumn, but still wicked, but I don’t think too unprecedented. And lastly, the CIMSS Satellite Blog with some mountain wave captures…never fun if you’re flying.

Lastly, in what could be the coolest minor league sports move ever, the Omaha Royals have changed their name to the “Storm Chasers!” I don’t know if the Royals “brand” has been tarnished in recent years, which prompted the change, but it’s really cool regardless. The article does point out that things have changed in recent years (see: Lehigh Valley IronPigs, Richmond Flying Squirrels, etc.). I’m all for cool minor league team names.

PSU E-Wall GFS Model Map for Saturday Evening

Just a quick synopsis here on what’s coming. The image to the left shows the GFS model’s depiction of weather on the West Coast come Saturday evening. This is a MUCH different look than we’ve seen of late out here, with almost 60-70% of days I would suspect having offshore flow, dry weather, and oodles of sunshine…a nice respite after an awful summer. Well, the storm door has officially opened. And it starts this weekend. Strong low pressure off the British Columbia coast is driving a series of cold fronts, rain, and snow into the Northwest and eventually down the coast. By Saturday evening, that low pressure parks along the Oregon coast. As we go through the next few days, each one of the cold fronts swinging through is going to reinforce and strengthen cold air over the Northwest, driving down snow levels to around 2,000′ initially, then below 1,000′, and then perhaps down to “ground level” by the time we get to late in the weekend, so places like Seattle and Portland may not be exempt from snowfall. And this could set the stage for a White Thanksgiving for a lot of places in the Northwest.

Down here in California, it’s going to get colder as well, with Sierra snowfall likely, and even snow in the SoCal mountains. Just assuming from the maps, without specifically forecasting, that snow levels will approach or dip below 5,000′ in the San Gabriel and/or San Bernardino Mountains early next week. The question I guess becomes whether or not we see any precipitation at that time. This is a very interesting and cold pattern for the West Coast though, so the next few days definitely should be fun to watch.

This cold air should also work its way to the east during Thanksgiving week, bringing a  pretty strong cold shot to the East cities just after Thanksgiving. Stay tuned!

Funny Friday

Not sure if this will become a tradition or not, but I’ve got a couple fun videos to tag at the end of this post. First some odds, ends, and links.

I had an opportunity to visit a wind farm today, and I have to say, it’s truly one of the coolest things you’ll see. I’ve passed by on highways before, but I’ve never been up close and personal with turbine blades. Just the size, scope, and magnitude of a project like a wind farm is incredible. Like I’ve said in the past, I don’t know if wind power is cost effective enough (until cost-effective, large battery storage capabilities are developed) to really become a serious mainstay, but just the ability to harness the power of wind…and to see how it’s done…really awesome.

Contrail in the Mojave Desert, 11/12/10

In a somewhat related note, we happened to catch a cool looking contrail while at the farm. You can see it pictured at the left. I just wanted to point this out to you because of last week’s “missile” incident near LA. As you can see, the path of a plane can do some funky things to the plane’s contrail, and this was no exception. Had you not been able to see the plane, you might be asking what’s going on here. So at sunset, things change dramatically.

Now on to some links…

Folks in the Mid-Atlantic won’t have climatology on their side if they want a repeat of last winter. My college buddy Jared of the NWS in Sterling, VA provides some of the hard math on how substantial snow is much more rare in winters featuring a pretty potent La Nina, such as the winter of 2010-2011 will have.

The Capital Weather Gang looks back on the Veteran’s Day snowstorm of 1987 that paralyzed DC.

November 10th, 2002 was an epic severe weather day across the country. Greg Nordstrom looks back on it. The sheer number of reports is staggering.

Cliff Mass has a fantastic article on Seattle’s preparedness for winter snow. It’s a good read for anyone curious as to planning for winter weather or anyone interested in community safety in hazardous weather.

Mt. Rainier is on my hit list of places I have to go see somewhat close up during my lifetime. Here’s an article on lenticular clouds capping the peak, and how it can occasionally put on spectacular visual shows with that.

The CIMSS Satellite Blog shows a skinny band of accumulated snow from Wyoming to North Dakota. Some parts of the Plains and Midwest are getting some heavy snow today and tonight. Winter Storm Warnings are up from Duluth through western Iowa. Should be some interesting storm totals out there when all is said and done.

A follow up on my blog entry from the other night about Dr. Judith Curry. The Republicans will have an additional witness in each panel at the House “Rational Discussion of Climate Change” next week.

Alright on to fun video. First off, a weathercaster in Toronto had an unfortunate run in with a polar bear. Well, not him per se, but his microphone, well…yeah:

And lastly, Ellen DeGeneres tees off on television meteorologists for being silly sometimes during weather, whereas you rarely see news people doing the same thing.

http://addins.kwwl.com/blogs/weather/archives/11296?mediaKey=12eace51-0a04-41e6-be55-de8bdbfe7fea&isShareURL=true

She makes a valid point for sure, and these are some things I was taught once I got into the business. But, also, keep in mind, she is talking about Los Angeles. And everything is a big joke out here with regard to weather (with maybe one or two exceptions…who are actually some fantastic TV meteorologists). But I digress…if you’re a meteorologist…just be resigned to the fact that you’ll never be right, no matter how hard you try. 😉

The Missile Launch Edition

An interesting 24 hours here in SoCal. This story about the “missile” is fascinating.  If you haven’t seen the video, here’s the report from a San Diego CBS affiliate (they do a lot of cross-work/outsourcing to their sister station in LA):

So you be the judge. Is that a missile? At first, I was flat sold on it. And to some extent I’m still skeptical it isn’t. What appears to be a rapid movement of whatever it is has me still curious. Time for the obligatory: BUT. But…sunset can do some mighty weird tricks to your eyes. I’ve seen high level clouds at sunset that were at least 100 miles offshore before. And as explained in this blog entry (based on a similar event from several months ago), it’s entirely possible, if not likely, that what was witnessed off the coast of LA was not a missile, but a contrail from a commercial jet. In fact, the author of that blog has pinned down what flight they suspect it was. The government subscribes to that theory…for what it’s worth I suppose. The chopper pilot who caught whatever it was seems to be convinced otherwise. I’m going to cautiously side with the government’s explanation for now. Like I said, weird optical tricks can be played on you at sunset, and the theory about the flight, the timing, and the flight path makes sense. Yesterday was a decent day for contrails as well, so that explanation doesn’t come off as a cop out…it seems rather legitimate. We’ll see what we find out down the line.

Volcano

Damage from Mt. Merapi's Eruption in Indonesia from videographer James Reynolds: http://yfrog.com/0wcnprj

Indonesia continues to be active. Mt. Merapi is so much of an issue right now that President Obama is having to cut short his visit to the country because of concerns about ash from the volcano. Ash and aircraft do not mix at all, so this is probably a prudent move. The image to the left is damage from Merapi as seen by James Reynolds, a videographer of all things natural disaster. Like the volcano in Iceland earlier this year, there is a webcam set up near the mountain. Unfortunately this seems to be very hot and cold, so you may want to bookmark it and periodically check it. According to the Eruptions volcano blog, the estimate is that Merapi has had a VEI (Volcano Explosivity Index) of between 3 and 4 so far. Just to put this in perspective, Mt. Redoubt in Alaska, which erupted in the spring of 2009 was around a VEI3. Our Icelandic volcano this past year (Eyjafjallajökull) was probably similar, if not a little less than Redoubt. So there isn’t anything substantially noteworthy about this from a large scale perspective at this point. For Merapi, this is a pretty typical eruption for it, where historically they’ve had VEI3-4 eruptions.

Lastly, here’s some Associate Press footage of the ash cloud from Merapi. Certainly an impressive scene:

Hitting the Links

Snow fell in Denver finally today, marking the first for them this winter season as well. Those of you snow hounds will enjoy some of the videos in that link, shot by storm chaser Tony Laubach.

A weather enthusiast in Seattle has been analyzing the satisfaction or misery of the summer and winter seasons by doing a statistical analysis. Well, it turns out the summer of 2010 was the 6th worst summer in Seattle since 1948. Summers and autumns in Seattle can be phenomenal, so this is ashame, especially since we’re in a La Nina, which climatologically favors greater than normal precipitation in the Northwest in winter.

Additional work is underway to try and secure New Orleans and surrounding areas from storm surge impacts during a hurricane.

Lastly, a fascinating blog entry…warning: long read about the scientific method and its applications in the current climate science debate. The author is a sociologist of science (awesome title), which basically means he’s studying the philosophy of science. It’s well worth a read (in fact, I am going to re-read it), as the argument about adhering to the principles of the scientific method has been a point of contention, especially since Climategate.